skip to main |
skip to sidebar
Sunday, December 28, 2014
Posted by
Corey Harrell
Christmas is in the rear view mirror and you may be left wondering about the gift you didn't find under the tree. The gift loaded with DFIR goodness to bring you into the new year. A gift you can use to improve your knowledge and skills. A gift to help you get to the next level in digital forensics, incident response, or malware analysis. You didn't get any DFIR goodness so it's a great opportunity to reward yourself with a gift of your own choice; one to accomplish what the previous sentences alluded to. If you fit this description then the book The Art of Memory Forensics is what you should be looking for. Even if the description doesn't fit and you don't already own this book then you should seriously check it out. This post is my review of the book The Art of Memory Forensics.
Three in One
The book addresses memory forensics on the following three operating systems: Windows, Linux, and Mac. This makes it an outstanding book since it addresses the most commonly faced operating systems. Furthermore, the content not only addresses memory forensic techniques but goes into detail about operating system internals. The majority of the systems I encounter are Windows systems so my focus was on the Windows portion of the book. (I did skim the other sections but I took my time in the Windows section.) The content went deep into the various Windows data structures and function calls. This makes the book an outstanding reference to better understand operating system internals. I easily envision myself using this book as a reference for years to come.
Not Just Words but Hands-on
One thing I tend to look for in a technical security book is how easy is it for the reader to take the content/techniques then apply it elsewhere. This is another area where the Art of Memory Forensics shines. The book's website provides additional materials that accompany the book. The items include lab questions, lab answers, and memory images for each chapter. This allows the reader an opportunity to do the hands-on labs to re-enforce that chapter's content. It's a great way to learn since you are actually performing memory forensics on an image after reading about it. Furthermore, to explain concepts the book uses - for the most part- memory images freely available on the Internet. As you read the book you can follow along by performing the same activities on the same memory images. At times the authors don't explicitly say what memory image they are using but the name of the memory images is pretty revealing. For example, in the Detecting Registry Persistence section (Kindle version page 4626) the Volatility handles plug-in is ran against a memory image named "laqma.mem". On the SampleMemoryImages webpage you can see a Laqma memory image is available and this is the one used in the book. This occurs frequently in the book as well as the authors specifically mentioning the memory image they are using.
The one area I thought that could make this book even better would be for the authors to explicitly state the memory image being used in the examples. This would make it easier for others (especially people who are not aware about the available memory images) to follow along in the book doing the same examples.
Memory Forensics in Toolbox
The last point I wanted to touch on about why I think so highly of this book is memory forensics is a process we need to have in our toolbox. This is true regardless if the work involves incident response or malware analysis. In incident response, there are times when you need to examine the volatile data on a system to obtain an answer. For example, a system is making network connections to a known malicious domain, which is setting off alerts. To tie the network connections to an actual process on the system requires memory forensics. The need for this in incident response is even more so with the recent increase of an exploit kit leveraging fileless malware. In malware analysis, there are times when memory forensics can provide additional information about a sample under examination. Does it open a socket, make network connections, inject code, hook functions, etc.. Memory forensics is now a process we need available in our toolbox and this book can help put it there.
All in All
If you are looking for a gift loaded with DFIR goodness, looking to improve your knowledge/skills, or looking for help to get to the next level in DFIR then this book is for you. The Art of Memory Forensics is a hefty book loaded with excellent content. It's an outstanding book and for those who don't already own it should seriously consider making it their next DFIR purchase. Just make sure to get your money's worth by grabbing the labs, memory images, and then putting hands to the keyboard as you read along.
Wednesday, December 17, 2014
Posted by
Corey Harrell
There are times when you are doing research and you notice certain behavior. You may had been aware about the behavior but you never consider the impact it has on other artifacts we depend on during our digital forensic and incident response examinations. After thinking about and researching the behavior and impact, it makes complete sense; so much so it's pretty obvious after the fact. In this post I'm exploring one such behavior and its impact I came across researching systems impacted by the Poweliks fileless malware. Specifically, how creating a suspended process and injecting code into it impacts the process's prefetch file.
The statement below is the short version describing the impact injecting code into a suspended process has on its prefetch file. For those wanting the details behind it the rest of the post explains it.
If the CreateProcess function creates a process in the suspended state and code gets injected into the process. The prefetch file for that process will contain the trace for the injected code and not the original process. Therefore, the prefetch file can be an indicator showing this technique was used.
Process Hollowing Technique
Malware uses various techniques to covertly execute code on systems. One such technique is process hollowing, which is also known as process replacement. The book Practical Malware Analysis states the following in regards to this technique:
"Process replacement is used when a malware author wants to disguise malware as a legitimate process, without the risk of crashing a process through the use of process injection.
Key to process replacement is creating a process in a suspended state. This means that the process will be loaded into memory, but the primary thread of the process is suspended. The program will not do anything until an external program resumes the primary thread, causing the program to start running"
In addition, the book The Art of Memory Forensics states the following:
"A malicious process starts a new instance of a legitimate process (such as lsass.exe) in suspended mode. Before resuming it, the executable section( s) are freed and reallocated with malicious code."
In essence, process hollowing is when a process is started in the suspended state, code is injected into the process to overwrite the original data, and when the process is resumed the injected code is executed. In a future post I will go into greater detail about this technique but for this post I wanted to keep the description at a high level.
Windows Internals Information
To fully explore the process hollowing behavior on a Windows system and its impact on the prefetch file it is necessary to understand Windows internals. Specifically, when and why prefetch files are created and how processes are created.
Windows Prefetcher Information
Prefetch files are a well known and understood artifact within the DFIR field. These files are a byproduct of the Windows operating system trying to speed up either the boot process or applications startup. The book Windows Internals, Part 2: Covering Windows Server 2008 R2 and Windows 7 states the following:
"The prefetcher tries to speed the boot process and application startup by monitoring the data and code accessed by boot and application startups and using that information at the beginning of a subsequent boot or application startup to read in the code and data."
As it relates to application prefetch files the book continues by saying:
"The prefetcher monitors the first 10 seconds of application startup."
The information the prefetcher monitors is explained as follows:
"The trace assembled in the kernel notes faults taken on the NTFS master file table (MFT) metadata file (if the application accesses files or directories on NTFS volumes), on referenced files, and on referenced directories."
In essence, if the prefetcher is enabled on a Windows systems then the first 10 seconds of execution is monitored to determine what files and directories the application accesses. This information (or trace) is then recorded in a prefetch file located inside the C:\Windows\Prefetch directory.
Windows Flow of Process Creation
Knowing about process hollowing and prefetching is not enough. It's necessary to understand the flow of process creation in order to see the various activities that occur when a process is created. The book Windows Internals, Part 1: Covering Windows Server 2008 R2 and Windows 7 goes into great detail about process creation and below are the main stages:
1. Validate parameters; convert Windows subsystem flags and options to their native counterparts; parse, validate, and convert the attribute list to its native counterpart.
2. Open the image file (. exe) to be executed inside the process.
3. Create the Windows executive process object.
4. Create the initial thread (stack, context, and Windows executive thread object).
5. Perform post-creation, Windows-subsystem-specific process initialization.
6. Start execution of the initial thread (unless the CREATE_ SUSPENDED flag was specified).
7. In the context of the new process and thread, complete the initialization of the address space (such as load required DLLs) and begin execution of the program.
The picture below illustrates the process creation main stages:
The main stages highlight a very important point as it relates to process hollowing. When the a process is created it doesn't start executing until Stage 7. If the process is created in a suspended state then the first 6 stages are completed. The question is when does the prefetcher come into play. The book Windows Internals Part 1 states the following activity occurs in stage 7:
"Otherwise, the routine checks whether application prefetching is enabled on the system and, if so, calls the prefetcher (and Superfetch) to process the prefetch instruction file (if it exists) and prefetch pages referenced during the first 10 seconds the last time the process ran."
This is very important so it is worth repeating. The prefetcher monitoring application startup occurs in stage 7 when the application is executing. However, a process that is created in the suspended state does not execute until it is resumed. This means if the process hollowing technique is used then when the process resumes and executes the injected code the prefetcher is monitoring the files/directories accessed by the injected code and not the original process. In shorter words:
If the CreateProcess function creates a process in the suspended state and code gets injected into the process. The prefetch file for that process will contain the trace for the injected code and not the original process. Therefore, the prefetch file can be an indicator showing this technique was used.
Process Hollowing Prefetch File
It's always helpful to see what is being described in actual data to make it easier to how it applies to our examinations. To generate a prefetch file I double-clicked the svchost.exe executable located in the C:\Windows\Prefetch directory. Below is the partial output from this prefetch file being parsed with Harlan Carvey's pref.pl script in the WFA 4th edition book materials. (One note about the prefetch file; I added the underscore at the end to force the creation of a new prefetch file.)
File : C:\Prefetch\SVCHOST_.EXE-3530F672.pf
Exe Path : \DEVICE\HARDDISKVOLUME1\WINDOWS\SYSTEM32\SVCHOST.EXE
Last Run : Wed Dec 17 20:58:57 2014
Run Count: 1
Module paths:
\DEVICE\HARDDISKVOLUME1\WINDOWS\SYSTEM32\NTDLL.DLL
\DEVICE\HARDDISKVOLUME1\WINDOWS\SYSTEM32\KERNEL32.DLL
\DEVICE\HARDDISKVOLUME1\WINDOWS\SYSTEM32\UNICODE.NLS
\DEVICE\HARDDISKVOLUME1\WINDOWS\SYSTEM32\LOCALE.NLS
As shown above, the svchost.exe executed one time and some of the files accessed are reflected in the module paths section. I asked Harlan about where the executable path comes from in prefetch parsers since the prefetch file format does not record the executable path. He confirmed what I was assuming. Prefetch parsers search the module paths for the name of the executable referenced at offset 0x0010.
Now let's take a look at the prefetch file for a svchost.exe process that was hollowed out. The Lab12-02.exe executable provided with Practical Malware Analysis performs process hollowing to the svchost.exe process. This can be seen performing dynamic analysis on the executable. The images below are from the executable being ran in Malwr.
Lab12-02.exe first creates the svchost.exe process in the suspended state. Notice the creation flag of 0x00000004. Also, make note about the process handle to the suspended process (0x00000094).
Lab12-02.exe then continues by injecting code into the suspended svchost.exe process.
Lab12-02.exe finishes injecting code into the suspended svchost.exe process with the process handle 0x00000094 before it resumes the suspended process.
Below is the partial output from this prefetch file being parsed with Harlan's pref.pl script.
File : C:\ Prefetch\SVCHOST.EXE-3530F672.pf
Exe Path : SVCHOST.EXE-3530F672.pf
Last Run : Wed Dec 17 20:59:48 2014
Run Count: 1
Module paths:
\DEVICE\HARDDISKVOLUME1\WINDOWS\SYSTEM32\NTDLL.DLL
\DEVICE\HARDDISKVOLUME1\WINDOWS\SYSTEM32\KERNEL32.DLL
\DEVICE\HARDDISKVOLUME1\WINDOWS\SYSTEM32\UNICODE.NLS
\DEVICE\HARDDISKVOLUME1\WINDOWS\SYSTEM32\LOCALE.NLS
It may not be obvious in the partial output but the files accessed by the injected code is different than the normal svchost.exe process. One of the more obvious files is what is not accessed; the original executable itself. Notice how the executable path contains the name of the prefetch file and this is due to the actual svchost.exe process not being accessed within 10 seconds of the injected code running.
Circling Back To Poweliks
I mentioned previously that I noticed this behavior when researching the Poweliks fileless malware. This malware doesn't write its binary to disk since it stays in memory. The malware is not only not on the hard drive but other typical artifacts may not be present as well (such as the normal program execution artifacts.) In the near future I'll have a detailed post about how to triage systems impacted by this malware but I wanted highlight why the information I shared in this post matters. The screenshot below shows parsed prefetch files from a test system infected with a Poweliks dropper. My only clue to you is: one prefetch file is not like the others?
There is one dllhost.exe prefetch file that has the missing process path. A closer inspection of this prefetch file reveals some other interesting file access during application start-up:
During access start-up files associated with Internet activity were accessed in addition to the WININET.DLL dll for making HTTP requests. When Poweliks (or at least the samples I've reviewed) initially infects a computer it performs the following actions: rundll32.exe process starts the powershell.exe process that then starts a suspended dllhost.exe and injects code into it. Powershell.exe then resumes the dllhost.exe process that executes the Poweliks malicious code. The screenhots above illustrate the behavior of process hollowing performed by Poweliks and the impact on the dllhost.exe prefetch file.
The above indication of the missing executable path in the dllhost.exe prefetch file is only for the initial infection when process hollowing is used. (The malicious code doesn't access the file it injects in once it executes) If Poweliks remains persistent and the system reboots the malicious code is still injected into dllhost.exe process but it doesn't appear to be process hollowing. These dllhost.exe prefetch files will contain the dllhost.exe executable path; along with the trace for suspicious file access as shown in the last screenshot. This is reflected in the second dllhost.exe prefetch file highlighted in the above screenshot.
Conclusion
Uncovering behaviors during research is helpful to put something you take for granted in a different perspective. Process hollowing behaves in a specific way in the Windows operating system and it can impact prefetch files in a specific way. This impact can be used as an indicator to help explain what occurred on a system but it needs context. A missing process executable in a prefetch file does not mean process hollowing occurred. However, a missing process executable along with suspicious file access during application start-up and an indication a system was compromised means something completely else.
Sunday, November 23, 2014
Posted by
Corey Harrell
I went to my local hardware store to buy one of the latest hammers. I brought the hammer home but it was unable to build the shed in my backyard. I spoke to someone else who said something similar. They bought the hammer and it didn't build what they wanted it to do. The expectation was that the hammer should do what it needs to do automatically and if it doesn't then the hammer is broken. It doesn't live up to its expectations, it wasn't the best investment, and the hammer developers need to start over.
Every now and then there are articles about how a certain security technology is broken. The recent focus of criticism is SIEM technology. It's broken because it doesn't do everything automatically and live up to peoples' expectations. The expectation that the technology should be able to be implemented and then automatically solve problems. Similar, to the expectation of a shed being built by simply buying a hammer. The hammer is not at fault; similar to the security technology not being at fault. Both of them are tools and the issue is with who is wielding that tool.
The hammer is not broken. The security technology is not broken. What is broken is the person (or organization) holding the tool. They need the critical thinking and problem solving skills to make the tool do what it needs to do and meet expectations along the way.
"analysts can be trained to use a tool in a rudimen-tary manner, they cannot be trained in the mind-set or critical thinking skills needed to master the tool"
~ Carson Zimmerman
The issue is not with the tool. The issue is the organization hasn't put the tool in the right peoples' hands and until they do the brokenness won't be fixed.
Wednesday, November 5, 2014
Posted by
Corey Harrell
An alert fires about an end point potentially having a security issue. The end point is not in the cubicle next to you, not down the hall, and not even in the same city. It's miles away in one of your organization's remote locations. Or maybe the end point is not miles away but a few floors from you. However, despite its closeness the system has a one terabyte hard drive in it. The alert fired and the end point needs to be triaged but what options do you have. Do you spend the time to physically track down the end point, remove the hard drive, image the drive, and then start your analysis. How much time and resources would be spent approaching triage in this manner? How many other alerts would be overlooked while the focus is on just one? How much time and resources would be wasted if the alert was a false positive? In this post I'll demonstrate how the Tr3secure collection script can be leveraged to triage this type of alert.
Efficiency and Speed Matters
Triaging requires a delicate balance between thoroughness and speed. Too much time spent on one alert means not enough time for the other alerts. Time is not your friend when you are either trying to physically track down a system miles away or imaging a hard drive prior to analysis. Why travel miles when milliseconds will do? Why collect terabytes/gigabytes when megabytes will do? Why spend time doing deep dive analysis until you confirm you have to? The answer to all these questions is to walk the delicate balance between thoroughness and speed. To quickly collect only the data you need to confirm if the alert is a security event or false positive. The tools one selects for triage is directly related to their ability to be thorough but fast. One crop of tools to help you strike this balance are triage scripts.
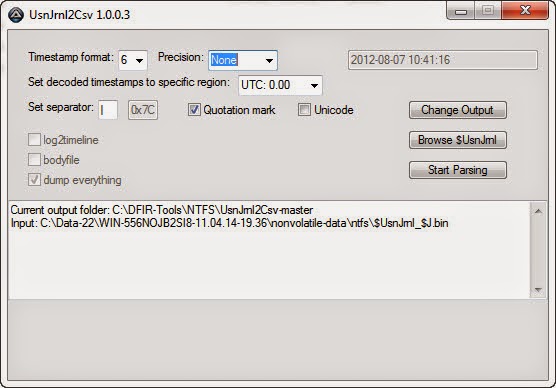
Triage scripts automate parts of the triage process; this may include either the data collection or analysis. The Tr3secure collection script automates the data collection. In my previous post - Tr3Secure Collection Script Updated - I highlighted the new features I added in the script to collect the NTFS Change Journal ($UsnJrnl) and new menu option for only collecting NTFS artifacts. Triaging the alert I described previously can easily be done by leveraging Tr3Secure collection script's new menu option.
To demonstrate this capability I configure a virtual machine in an extremely vulnerable state then visited a few malicious sites to provide me with an end point to respond to.
Responding to the System
The command prompt was accessed on the target system. A drive was mapped to a network share to assist with the data collection. The network share not only is where the collected data will be stored but it is also where the Tr3Secure collect script resides. The command below uses the Tr3Secure collection script NTFS artifacts only option and stores the collected data in the network share with the drive (Y:). Disclaimer: leveraging network shares does pose a risk but it allows for the tools to be executed without being copied to the target and for the data to be stored in a remote location.
The image below shows part of the output from the command above.
The following is the data that was collected using Tr3secure collection script's NTFS artifacts only option:
- Recentfilecach.bcf
- Prefetch files
- Master File Table ($MFT)
- NTFS Change Journal ($UsnJrnl)
- NTFS Logfile ($Logfile)
Triaging
Collecting the data is the first activity in triaging. The next step is to actually examine the data to confirm if the alert is an actual security event or a false positive. The triage process will vary based on what the event is. A fast spreading worm varies from a Trojan. Antivirus alerts vary from malicious network traffic (i.e. an end point communicating with a malicious IP). The scenario demonstrated in this post is for an alert firing that requires triaging an end point. There are certain indicators to look for when triaging end points for malware as outlined below:
- Programs executing from temporary or cache folders
- Programs executing from user profiles (AppData, Roaming, Local, etc)
- Programs executing from C:\ProgramData or All Users profile
- Programs executing from C:\RECYCLER
- Programs stored as Alternate Data Streams (i.e. C:\Windows\System32:svchost.exe)
- Programs with random and unusual file names
- Windows programs located in wrong folders (i.e. C:\Windows\svchost.exe)
- Other activity on the system around suspicious files
In addition to looking for the above indicators, it is necessary to ask yourself a few important questions.
1. What was occurring on the system around the time the alert generated?
2. Is there any indicators in the alert to use examining the data?
3. For any suspicious or identified malicious code, did it execute on the system?
The triage steps to use is dependent on the collected data. In this case, the data collected with NTFS artifacts option results in only examining: program execution and filesystem activity. These two examination steps are very effective for triaging end points as I previously illustrated in my post Triaging Malware Incidents.
Examining Program Execution Artifacts
The first artifact to check is the Recentfilecach.bcf to determine if any stand-alone programs executed on the endpoint. The file can be examined using a hex editor or Harlan's rfc.exe tool included in his WFA 4/e book materials. The command below parses this artifact:
rfc.exe C:\Data-22\WIN-556NOJB2SI8-11.04.14-19.36\preserved-files\AppCompat\RecentFileCache.bcf
The image below is highlighting a suspicious program. The program stands out since it is a program that executed from the lab user profile's temporary internet files folder. Right off the bat this artifact provides some useful information. The coffee.exe program executed within the past 24 hours, the program came from the Internet using the Internet Explorer web browser, and the activity is associated with the lab user profile.
The second program execution artifact collected during the NTFS artifacts only option are prefetch files. The command below parses this artifact with Winprefetchview:
winprefetchview.exe /folder C:\Data-22\WIN-556NOJB2SI8-11.04.14-19.36\preserved-files\Prefetch
The parsed prefetch files were first sorted by process path to find any suspicious programs. Then they were sorted by last run time to identify any suspicious programs that executed recently or around the time of the alert. Nothing really suspicious jumped out in the parsed prefetch files. However, there was a svchost.exe prefetch file and this was examined since it may contain interesting file handles related to the suspicious program listed in the Recentfilecach.bcf. (to see why review my Recentfilecach.bcf post and pay close attention to where I discuss the process svchost.exe) This could be something but it could be nothing. The svchost.exe process had a file handle to the ad[2].htm file located in the temporarily internet files folder as shown below:
Examining Filesystem Artifacts
The Tr3Secure collection script collects the NTFS $MFT, $Logfile, and $UsnJrnl; all of which can provide a wealth of information. These artifacts can be examined in two ways. First is to parse them and then look at the activity around the time the alert fired. Second, is to parse them and then look at the activity around the time of the identified suspicious files appeared on the system. In this post I'm using the latter method since the alert is hypothetical.
The $MFT was parsed with Joakim Schicht's MFT2CSV program. The output format is in the log2timeline format to make it into a timeline.
The MFT2CSV csv file was imported into Excel and a search was performed for the file "coffee.exe". It's important to look at the activity prior to this indicator and afterwards to obtain more context about the event. As illustrated below, there was very little activity - besides Internet activity - around the time the coffee.exe file was created. This may not confirm how the file got there but it does help rule out certain attack avenues such as drive-by downloads.
The image below shows what occurred on the system next. There is activity of Java executing and this may appear to be related to a Java exploit. However, this activity was due to Java update program executing.
The last portion of the $MFT timeline is shown below. A file with the .tmp extension was created in the temp directory followed by the creation of a file named SonicMaster.exe in the System32 folder. SonicMaster.exe automatically becomes suspicious due to its creation time around coffee.exe (guilty by association.) If this is related then that means the malware had administrative rights, which is required to make modifications to the System32 folder. The task manager is executed and then there was no more obvious suspicious activity in the rest of the timeline. The remaining activity was the lab user account browsing the Internet.

At this point the alert has been properly triaged and confirmed. The event can be escalated according to the incident response procedures. However, addition context can be obtained by parsing the NTFS Change Journal ($UsnJrnl). Collecting this artifact was the most recent update to the Tr3Secure collection script. The $UsnJrnl was parsed with Joakim Schicht's UsnJrnl2CSV program.
The UsnJrnl2CSV csv file was imported into Excel and a search was performed for the file "coffee.exe". It's important to look at the activity prior to this indicator and afterwards to obtain more context about the event. The $UsnJrnl shows the coffee.exe file being dropped onto the system from the Internet (notice the [1] included in the filename.)
The next portion as shown below, shows coffee.exe executing, which resulted in the modification to the Recentfilecache.bcf. Following this the tmp file is created along with the SonicMaster.exe file. The interesting activity is the data overwrites made to the SonicMaster.exe file after it's created.
Immediately after the SonicMaster.exe file creation the data overwrites continued to other programs as illustrated below. To determine what is happening would require those executables to be examined but it appears they had data written to them.
The executables were initially missed in the $MFT timeline since the files by themselves were not suspicious. They were legitimate programs located in their correct folders. However, the parsed $UsnJrnl provided more context about the executables and circling back around to the $MFT timeline shows the activity involving them. Their $MFT entries were updated.
Conclusion
As I mentioned previously, triaging requires a delicate balance between thoroughness but speed. It's a delicate balance between quickly collecting and analyzing data from the systems involved with an alert to determine if the alert is a security event or false positive. This post highlighted an effective technique for triaging an end point and the tools one could use. The entire technique takes minutes to complete from beginning to end. The triage process did not confirm if the activity is a security event but it did determine additional time and resources needs to be spent digging a bit deeper. Doing so would had revealed that the coffee.exe file is malicious and is actually the Win32/Parite file infector. The malware infects all executables on the local drive and network shares. Digging even deeper by performing analysis on coffee.exe (Malwr report and Anubis report) matches the activity identified on the system and even provides more indicators (such as an IP address) one could use to search for other infections in the environment.
Sunday, November 2, 2014
Posted by
Corey Harrell
It was a little over four years ago I started a new journey. The timing wasn't the best when I took my first step into the blogging world. My family welcomed our third son into the world, I was doing challenging work for my employer, and I was still pursuing my Masters degree attending school full time. Needless to say, starting a blog would just compete for the little spare time I had. After talking things over with my wife I took the first step by launching this blog: Journey Into Incident Response (jIIr.) I've been reflecting about this journey since jIIr has surpassed 500,000 page views.
So much has changed in the past four years. I started out with my sights set on incident response and now I'm building out and managing an enterprise-wide incident response and detection program. I have been sharing my journey, my research, and thoughts on jIIr for others to read and learn from. To those who either read one post or numerous posts I wanted to say thank you. Thank you for taking the time to read what I have written. To those who went one step beyond to leave a comment or send me an email I wanted to thank you as well. Blogging is a challenging endeavor and comments are very encouraging.
jIIr started out as a way for me to share back to the digital forensic and incident response community. Shortly after jIIr's launch my motivations changed. What drove me to maintain the blog was no longer sharing back to the community. It's not necessary to share my motivations because at the end of the day is what matters the most is my ability to help others by sharing what I do. Each jIIr post is an effort to help anyone who may read it. For them to take the information and apply it in their lives and/or work. To those people and organizations who have shared jIIr content either by linking to my posts, retweeting my tweets, forwarding along links, or sharing your thoughts on your own websites. Thank you. Thank you for sharing; jIIr would not be reaching the audience it is today without your support. To those who continue to share jIIr content, I cannot say how grateful I am.
The past four years have been a humbling experience. God has blessed my with a passion for DFIR and the ability to communicate in the written form. For as long as I'm capable, I'll continue to do what I do so at the end of the day others who stumble upon this site may be helped in some way.
Labels:
Tuesday, October 28, 2014
Posted by
Corey Harrell
On my to-do list for some time has been to add support back into the Tr3Secure collection script to obtain the NTFS Change Journal ($UsnJrnl). This is a quick post about this functionality being added back to the collection script.
The issue I faced was the following. There are very few tools capable of collecting NTFS artifacts from live systems; even fewer for collecting the $UsnJrnl. The Tr3Secure script uses Joakim Schicht's tool RawCopy to collect files off of live systems. It is one of the few and - as far as I know - the only open source option. Rawcopy pulls files either by their $MFT record number or the file path. Pulling NTFS artifacts requires the $MFT record number. The challenge is the $UsnJrnl does not have a consistent $MFT record number like the other NTFS artifacts. For most scripting languages this wouldn't be an issue but Tr3Secure is a batch script. Batch scripting doesn't support storing a command's output into a variable. Translation: there is not an easy way in batch scripting to query the $UsnJrnl's $MFT record number, store it into a variable, and then use that variable with RawCopy to collect it. This is why adding the functionality back into the script has been and remained on my to-do list until now.
Joakim Schicht's ExtractUsnJrnl
Joakim Schicht does outstanding work producing DFIR tools and releasing them open source. His Github site contains a wealth of tools. He even has a collection of tools for the collection and parsing of NTFS artifacts. For those who aren't familiar with his work then I highly advise you take the time to explore them (also his Google Code wiki page.) He recently released a new tool called ExtractUsnJrnl. The tool - in Joakim's words - does the following:
"$J may be sparse, which would mean parts of the data is just 00's. This may be a significant portion of the total data, and most tools will extract this data stream to its full size (which is annoying and a huge waste of disk space). This is where this tools comes in, as it only extract the actual data for the change journal. That way extraction obviously also goes faster. Why extract 20 GB when you might only need 200 MB?"
The tool not only collects the $UsnJrnl $J alternate data stream but it only extracts the portion containing data. This not only saves space but it makes the collection faster; especially if pulling it over the wire. The tool is command-line making it easy to script with. I updated the Tr3Secure collection script to use the ExtractUsnJrnl tool for grabbing the $UsnJrnl.
ExtractUsnJrnl in Action
ExtractUsnJrnl is really a cool tool so I wanted to take the time to highlight it. I performed a simple test. Collect the $UsnJrnl $J file with one tool (FTK Imager) to see how long it takes and what the file size is then use ExtractUsnJrnl.
The image below shows the $UsnJrnl from a 1TB solid state drive. The file size difference is significant; one file is 4.6GB while the other is 36MB. Both tools were ran locally but ExtractUsnJrnl completed within seconds.
The image below shows the $UsnJrnl from a 300GB removable drive. Again, notice the difference between the file sizes.
Some may be wondering why am I so focused on the resulting file size. The reason is trying to pull a 4.6GB file over the wire from a remote system takes time. A lot of time if that remote system is in a location with a slow network link (think VPN users). By reducing the file size (i.e. 36MB) makes it easier to collect the $UsnJrnl both remotely and locally to an attached storage device.
The next test I ran was to parse both $UsnJrnl $J files to see if the both contain around the same number of records. I said approximate because the hard drives were not write protected and changes may had been made between the collections. Due to this I evaluated the removable store device's NTFS Change Journal since the drive had less activity than the solid state drive.
The image below shows UsnJrnl2Csv successfully parsing the $UsnJrnl $J extracted with FTK Imager.
The image below shows UsnJrnl2Csv successfully parsing the $UsnJrnl $J extracted with ExtractUsnJrnl. Notice how this $J file had significantly less records.
Lastly, the image below shows the comparison of the two parsed $UsnJrnl $J files from the removable media. Both outputs start at the same time with the same file and end at the same time with the same file.
Another Tr3Secure Collection Update
Adding support to collect the $UsnJrnl is not the only update. The change log lists out all of them but I did want to highlight another one. An additional menu option was added to only collect the NTFS artifacts. There are times where I want to create a quick timeline with the NTFS artifacts to get more information about something. For example, an antivirus alert may had flagged a file but I'm interested in if anything else was dropped onto the system. In an instance like this, creating a timeline with both the $MFT and $UsnJrnl can quickly answer this question. I've been using a different collection script to grab just the NTFS artifacts but I decided to incorporate the functionality into the Tr3secure script. The menu option now appears as the following:
Selecting option 5 will only preserve select files then collect the $MFT, $Logfile, and $UsnJrnl.
You can download the TR3Secure Data Collection Script from the following download site. The link is also posted along the right hand side of this blog towards the top.
In the future I plan on doing a post or two illustrating how targeted collections using scripts - such as the Tr3secure collection script - can significantly speed up the time it takes to triage an alert or system.
Tuesday, October 21, 2014
Posted by
Corey Harrell
Organizing is what you do before you do something, so that when you do it, it is not all mixed up.
~ A. A. Milne
"Corey, at times our auditors find fraud and when they do sometimes they need help collecting and analyzing the data on the computers and network. Could you look into this digital forensic thing just in case if something comes up?" This simple request - about seven years ago - is what lead me into the digital forensic and incident response field. One of the biggest challenges I faced was getting a handle on the process one should use. At the time there was a wealth of information about tools and artifacts but there was not as much outlining a process one could use. In hindsight, my approach to the problem was simplistic but very effective. I first documented the examination steps and then organized every artifact and piece of information I learned about beneath the appropriate step. Organizing my process in this manner enabled me to carry it out without getting lost in the data. In this post I'm highlighting how this type of organization is applied to timeline analysis leveraging Plaso.
Examinations Leveraging Categories
Organizing the digital forensic process by documenting the examination steps and organizing artifacts beneath them ensured I didn't get "all mixed up" when working cases. To do examination step "X" examine artifacts A, B, C, and D. Approaching cases this way is a more effective approach. Not only did it prevent jumping around but it helped to minimize overlooking or forgetting about artifacts of interest. Contrast this to a popular cheat sheet at the time I came into the field (links to cryptome). The cheat sheet was a great reference but the listed items are not in an order one can use to complete an examination. What ends up happening is that you jump around the document based on the examination step being completed. This is what tends to happen without any organization. Jumping around in various references depending on what step is being completed. Not an effective method.
Contrast this to the approach I took. Organizing every artifact and piece of information I learned about beneath the appropriate step. I have provided glimpses about this approach in my posts: Obtaining Information about the Operating System and It Is All About Program Execution. The "information about the operating system" post I wrote within the first year of starting this blog. In the post I outlined a few different examination steps and then listed some of the items beneath it. I did a similar post for program execution; beneath this step I listed various program execution artifacts. I was able to write the auto_rip program due to this organization where every registry artifact was organized beneath the appropriate examination step.
Examination Steps + Artifacts = Categories
What exactly are categories? I see them as the following: Examination Steps + Artifacts = Categories. I outlined my examination steps on the jIIr methodology webpage and below are some of the steps listed for system examinations.
* Profile the System
- General Operating System Information
- User Account Information
- Software Information
- Networking Information
- Storage Locations Information
* Examine the Programs Ran on the System
* Examine the Auto-start Locations
* Examine Host Based Logs for Activity of Interest
* Examine Web Browsing
* Examine User Profiles of Interest
- User Account Configuration Information
- User Account General Activity
- User Account Network Activity
- User Account File/Folder Access Activity
- User Account Virtualization Access Activity
* Examine Communications
In a previous post, I said "taking a closer look at the above examination steps it’s easier to see how artifacts can be organized beneath them. Take for example the step Examine the programs ran on the system. Beneath this step you can organize different artifacts such as: application compatibility cache, userassist, and muicache. The same concept applies to every step and artifact." In essence, each examination step becomes a category containing artifacts. In the same post I continued by saying "when you start looking at all the artifacts within a category you get a more accurate picture and avoid overlooking artifacts when processing a case."
This level of organization is how categories can be leveraged during examinations.
Timeline Analysis Leveraging Categories
Organizing the digital forensic process by documenting the examination steps and organizing artifacts is not limited to completing the examination steps or registry analysis. The same approach works for timeline analysis. If I'm looking to build a timeline of a system I don't want everything (aka the kitchen sink approach.) I only want certain types of artifacts that I layer together into a timeline.
To illustrate let's use a system infected with commodity malware. The last thing I want to do is to create a supertimeline using the kitchen sink approach. First, it takes way too long to generate (I'd rather start analyzing than waiting.) Second, the end result has a ton of data that is really not needed. The better route is to select the categories of artifacts I want such as: file system metadata, program execution, browser history, and windows event logs. Approaching timelines in this manner makes them faster to create and easier to analyze.
The way I created timelines in this manner was not efficient as I wanted it to be. Basically, I looked at the timeline tools I used and what artifacts they supported. Then I organized the supported artifacts beneath the examination steps to make them into categories. When I created a timeline I would use different tools to parse the categorized artifacts I wanted and then combine the output into a single timeline in the same format. It sounds like a lot but it didn't take that long to create it. Hell, it was even a lot faster than doing the kitchen sink approach.
This is where Plaso comes into the picture by making things a lot easier to leverage categories in timeline analysis.
Plasm
Plaso is a collection of timeline analysis tools; one of which is plasm. Plasm is capable of "tagging events inside the plaso storage file." Translation: plasm organizes the artifacts into categories by tagging the event in the plaso storage file. At the time of this post the tagging occurs after the timeline data has already been parsed (as opposed to specifying the categories and only parsing those during timeline generation.) The plasm user guide webpage provides a wealth of information about the tool and how to use it. I won't rehash the basics since I couldn't do justice to what is already written. Instead I'll jump right in to how plasm makes leveraging categories in timeline analysis easier.
The plasm switch " --tagfile" enables a tag file to be used to define the events to tag. Plaso provides an example tag file named tag_windows.txt. This is the feature in Plaso that makes it easier to leverage categories in timeline analysis. The artifacts supported by Plaso are organized beneath the examination steps in the tag file. The image below is a portion of the tag_jiir.txt tag file I created showing the organization:
tag_jiir.txt is still a work in progress. As can be seen in the above image, the Plaso supported artifacts are organize beneath the " Examine the Programs Ran on the System" (program execution) and " Examine the Auto-start Locations" (autostarts info) examination steps. The rest of the tag file is not shown but the same organization was completed for the remaining examination steps. After the tag_jiir.txt tag file is applied to plaso storage file then timelines can be created only containing the artifacts within select categories.
Plasm in Action
It's easier to see plasm in action in order to fully explore how it helps with using categories in timeline analysis. The test system for this demonstration is one found laying around on my portable drive; it might be new material or something I previously blogged about. For demonstration purposes I'm running log2timeline against a forensic image instead of a mounted drive. Log2timeline works against a mounted drive but the timeline will lack creation dates (and at the time of this post there is not a way to bring in $MFT data into log2timeline.)
The first step is taking a quick look at the system for any indications that the system may be compromised. When triaging for potential malware infected system the activity in the program execution artifacts excel and the prefetch files revealed a suspicious file as shown below.
The file stands out for a few reasons. It's a program executing from a temp folder inside a user profile. The file handle to the zone.identifier file indicates the file came from the Internet. Lastly, the program last ran on 1/16/14 12:32:14 UTC.
Now we move on to creating the timeline with the command below (the -o switch specifies the partition I want to parse.) FYI, the command below creates a kitchen sink timeline with everything being parsed. To avoid the kitchen sink use plaso filters. Creating my filter is on my to-do list after I complete the tag_jiir.txt file.
log2timeline.exe -o 2048 C:\Atad\test-data\test.dump C:\Atad\test-data\test.E01
The image below shows the "information that have been collected and stored inside the storage container." The Plaso tool pinfo was used to show this information.
Now it is time to see plasm in action by tagging the events in the storage container. The command below shows how to do this using my tag_jiir.txt file.
plasm.exe tag --tagfile=C:\Atad\test-data\tag_jiir.txt C:\Atad\test-data\test.dump
The storage container information now shows the tagged events as shown below. Notice how the events are actually the categories for my examination steps (keep in mind some categories are not present due to the image not containing the artifacts.)
Now a timeline can be exported from the storage container based on the categories I want. The program execution indicator revealed there may be malware and it came from the internet. The categories I would want for a quick look are the following:
- Filesystem: to see what files were created and/or modified
- Web browsing: to correlate web browsing activity with malware
- Program execution: to see what programs executed (includes files such as prefetch as well as specific event logs
The command below creates my timeline based on the categories I want (-o switch outputs in l2tcsv format, -w switch outputs to a file, and filter uses the tag contains.) FYI, a timeslice was not used since I wanted to focus on the tagging capability.
psort.exe -o L2tcsv -w C:\Atad\test-data\test-timeline.csv C:\Atad\test-data\test.dump "tag contains 'Program Execution' or tag contains 'Filesystem Info' or tag contains 'Web Browsing Info'"
The image below shows the portion of the timeline around the time of interest, which was 1/16/14 12:32:14 UTC. The timeline shows the lab user account accessing their Yahoo web email then a file named invoice.83842.zip being downloaded from the internet. The user then proceeded to execute the archive's contents by clicking the invoice.83842.exe executable. This infection vector is clear as day since the timeline does not contain a lot of un-needed data.
Conclusion
Plaso's tagging capabilities makes things easier to leverage categories in timeline analysis. By producing a timeline containing only the categories one wants in order to view the timeline data for select artifacts. This type of organization helps minimize getting "all mixed up" when conducting timeline analysis by getting lost in the data.
Plaso is great and the tagging feature rocks but as I mentioned before I used a combination of tools to create timelines. Not every tool has the capabilities I need so combining them provides better results. In past I had excellent results leveraging the Perl log2timeline and Regripper to create timelines. At this point the tools are not compatible. Plaso doesn't have a TLN parser (can't read RegRipper's TLN plug-ins) and RegRipper only outputs to TLN. Based on Harlan's upcoming presentation my statement may not be valid for long.
In the end, leveraging categories in timeline analysis is very powerful. This train of thought is not unique to me. Others (who happen to be tool developers) are looking into this as well. Kristinn is as you can see in Plaso's support for tagging and Harlan wrote about this in his latest Windows forensic book.
Side note: the purpose of this post was to highlight Plaso's tagging capability. However, for the best results the filtering capability should be used to reduce what items get parsed in the first place. The kitchen sink approach just takes way too long; why wait when you can analyze.
Sunday, September 28, 2014
Posted by
Corey Harrell
In this post I'm releasing an installation guide to build a custom ticketing system to track and document security incidents. The guide contains nothing groundbreaking; just instructions on how to install and configure Request Tracker in CentOS with a PostgreSQL database and Apache web server. A significant portion of the work I compiled from others who are referenced in the beginning of the guide (some instructions were copied and pasted from these sources). The guide is released as is and my intention is not to be someone's technical support. I've seen numerous times people asking what ticketing systems do people use to track security incidents and the responses they receive is very limited. I'm releasing this for those interested in incident response (IR) ticketing systems so at least there will be another option to reference.
Why Request Tracker and Not Request Tracker for Incident Response
Request Tracker (RT) is an open source tracking system that organizations leverage for a range of uses. As written on the RT website, the uses include: "bug tracking, help desk ticketing, customer service, workflow processes, change management, network operations, and youth counseling." By design RT is very customizable making it an awesome choice as the platform for an IR ticketing system.
I know a common question will be why did I choose to use Request Tracker and not Request Tracker for Incident Response (RTIR). RTIR is after all a purposely built ticketing system for incident response. As I was exploring ticketing systems for incident response I spoke to two different people whose IR teams leveraged Request Tracker for their ticketing systems. I asked both of them the exact same question and they both had the same response. RTIR is not updated as frequently as RT so going with RT enables them to use newer functionality. After looking into both RT and RTIR I agreed with them. However, my decision was not solely based on frequent updates. RT allowed me to implement the workflow I wanted instead of being forced to use someone's else workflow in RTIR. My decision to use RT was for the more frequent updates and ability to implement my own workflow.
CSIRT Request Tracker Workflow
The image below shows the incident response workflow implemented in the ticketing system and the following subsections describes each area.
Incident Reported
One of my requirements for any ticketing system was the ability to automate documentation and communication amongst the Computer Security Incident Response Team (CSIRT) members. This is an area where RT excels and it does so using email. The Incident Reported area is where a security event is reported to the CSIRT. The report can come in through email and it will be automatically processed. The report can also be manual (i.e. by telephone) and either be converted into an email or typed directly into RT.
The ticketing system can be used even if email is not an option. RT has a nice web interface for managing and updating tickets.
Queues
The Queues area is where the ticket for the reported security event ends up. In the diagram there is only a General queue but RT supports having numerous queues. CSIRT members monitor the queue and any new tickets they take ownership of it. The ticket's status changes from new to triage once a member claims it.
Triage Activity
The Triage Activity area is where the reported security event is validated and escalated. The first decision made by the CSIRT member is determining if the rest of the CSIRT needs to be activated. Regardless if the CSIRT is activated or not, the reported event is triaged to determine if it meets the requirement to be declared an incident. If the reported event doesn't meet the security incident requirements then the CSIRT member who owns the ticket completes triaging it, resolves the event, and documents any IR metrics. Finally, the ticket's status is changed to closing. If reported event does meet the requirements to be declared a security incident then the ticket's status is changed to incident.
Incident Activity
The Incident Activity area is where all of the activities related to responding to, containing, and responding the security incident occur. All CSIRT members involved document their work in the ticket. The ticketing system sends out emails for every update to the ticket ensuring the whole CSIRT is aware of what is occurring and what other members are doing. Automating communication makes the response more efficient since time is not wasted holding unnecessary meetings. The ticket's status changes to closing once the incident is resolved.
Closing Activity
The Closing Activity area is for quality assurance and all tickets are forced though this area prior to being resolved. This is where the CSIRT lead reviews each ticket to verify all work has been completed and all metrics captured. Capturing metrics is critical for internal CSIRTs since it's one of the best ways to show value to management. The CSIRT lead also identifies in the ticket if there is a need to implement lessons learned or security monitoring improvements. If there isn't then the ticket is resolved. If there is then the ticket's status is changed to post incident status.
Post Incident Activity
The Post Incident Activity area is where the implementation of the lessons learned and security monitoring improvements are made. The work is appended to the same incident ticket to make easier to document and refer back to in the future. After the post incident work is completed then the ticket is finally resolved.
CSIRT Request Tracker Lifecycles
RT implements a workflow using something called a lifecycle. The lifecycle outlines ticket statuses and their behavior. Specifically, what a current status is allowed to be changed to. The diagram below shows the lifecycle that implements the workflow I described above. As can be seen in the diagram, the new and triage statuses have the ability to exit the workflow but once a ticket is changed to incident it is forced though the remaining workflow.
CSIRT Request Tracker Installation Guide
As I mentioned previously, this guide is released as is. I did test the installation procedure numerous times and believe I captured everything in the documentation. However, one item I didn't fully test is the email portion of the ticketing system since I didn't have a working email gateway for testing at the time.
This link points to the guides download location. The two guides are pretty much the same except one is to use fetchmail to retrieve email while the other uses sendmail to retrieve email. The latter makes the ticketing system into an email gateway. Due to this, my preference is for the fetchmail route since it's the easier path.